MeetMe: Where People Meet And Investors Make Money
Summary
MeetMe trades at ~6x EV/2016 consensus EBITDA, a 50% discount to comps, despite growing its Mobile business at a 95% 3-year CAGR.
MeetMe's financial leverage is powerful, and MEET should convert ~55% of incremental Mobile revenue dollars to free cash flow.
MeetMe is in the early innings of optimizing its Mobile advertising strategy and is already seeing dramatic increases in ARPU.
Pinnacle Fund - Dallas, TX - Greg@Pinnaclefund.com
MeetMe, Inc. (NASDAQ: MEET)
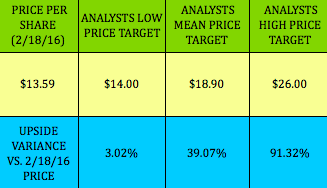
BUY Recommendation. Current Price $3.20, Price Target $5.70.
Fully Diluted Shares - 49.5m, Market Cap - $158m, Enterprise Value $144m, Cash $16.2m, Debt $1.7m, December Fiscal Year-End.

Overview
MeetMe is a location-based mobile chat app for connecting with new people. Unlike other social apps, 50% of people using MeetMe self-identify as looking for friendship as opposed to romance. MeetMe's users are able to see somebody's interests, a brief description, and several pictures. The CEO describes MeetMe as a digital bar targeting 18 to 30-year-olds.
MeetMe generates revenue from three business lines: Mobile (~80% of Revenue), Web (~10% of Revenue), and Social Theater (~10% of Revenue). ~90% of Mobile and Web revenue is from advertising, which differentiates MEET from subscription-centric dating companies. Subscription revenue is approximately 2% of Mobile/Web revenue, and in-app purchases make up the balance of Mobile revenue. Mobile revenue grew 66% year-over-year in the first 9 months of 2015 due to a fundamental change in the business: bringing mobile ad inventory management in-house.
MeetMe has developed a mobile app that has grown from 200,000 daily active users ("DAU") and 663,000 monthly active users ("MAU") in March 2011 to more than 1.1 million DAU and 4.0 million MAU in November 2015. MeetMe's Mobile business generated $6.1 million in 2012 revenue and has grown at a 94.7% CAGR to ~$45.0 million in 2015 through the effective monetization of its user base. MeetMe preannounced 4Q'15 earnings results on 1/6/2016 that beat company guidance; MEET will hold its 4Q'15 earnings call on 2/29/2016.
Investors should want to own MeetMe now because:
- Management is in the early innings of optimizing its mobile ad management strategy.
- MEET's financial leverage is powerful. ~70% of incremental Mobile revenue dollars convert to EBITDA, and ~80% of EBITDA converts to FCF. Therefore, ~55% of incremental Mobile revenue converts to FCF.
- Valuation is cheap. MeetMe trades at ~6x EV/2016 EBITDA, has a 12.5% FCF yield, and is growing.
- MeetMe is investing cash flow from operations into a share repurchase program.
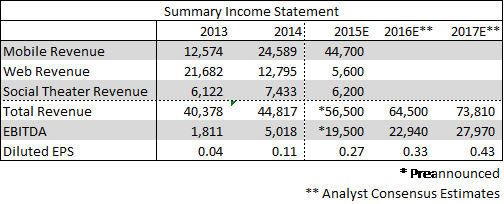
Below is a summary of MeetMe's Income Statement:
I would like to evaluate MeetMe by examining its:
- Mobile Opportunity
- Web Opportunity
- Social Theater Opportunity
- Management
- Competition
- Investment Risks
- Operating Leverage
- Valuation
- Technical Analysis
- Appendix
Mobile Opportunity - (~79% 2015E Revs, ~85% 2016E Revs)
Mobile Advertising Market
eMarketer's 2015 forecast expects mobile ad spending to increase nearly 100% from $30 billion in 2015 to $58 billion in 2018. The increase in mobile phone functionality is driving people to use their phone more.
Ask yourself, how often did you access the internet from your Motorola Razor in 2003? Or, how about your iPhone 1 in 2007 that had less RAM than most of today's smartwatches? Today's mobile technology is more conducive to consuming media on mobiles phones than in the past.
An April 2012 study by Pew Research Center finds that 55% of cell phone owners use their phone to go online. This is a dramatic increase from 31% of cell phone owners in April 2009. Consumer behavior is changing, and mobile phones are taking time share away from desktops/laptops.
The chart below shows the percent of time spent in media relative to the advertising spend. Clearly, there is a huge discrepancy between the amount of time that people are spending on mobile devices and ad spend. If mobile ad spend caught up to time spent consuming media on mobile devices, mobile ad spend would have to increase by $25 billion, according to Kleiner Perkins analyst Mary Meeker's Internet Trends Report, based on IAB 2014 data.
(click to enlarge)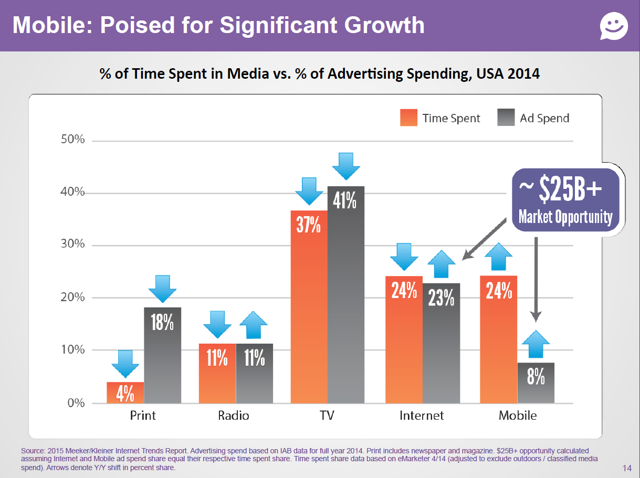 (Source: MeetMe's January 2016 Investor Presentation)
 (Source: MeetMe's January 2016 Investor Presentation)
The amount of time people spend on mobile phones consuming media is increasing rapidly. And, Millennials are using their mobile phone more than older generations, and Millennials (Americans aged 18 to 34 years old) are entering prime wage years. In other words, Millennials are becoming bigger targets for advertisers.
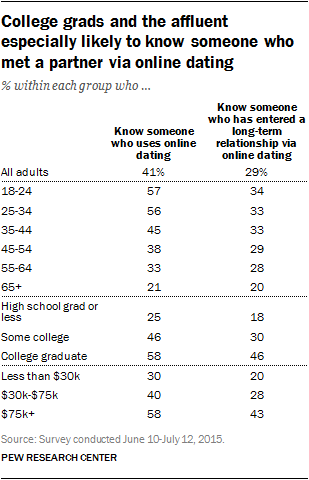
Where can advertisers find Millennials on mobile phones? How about the online dating industry? The negative stigma associated with online dating is dissipating. A July 2015 study by Pew Research Center reported that 22% of 18-24 year-olds use mobile dating apps, which is more than a 4x increase versus only 5% in 2013. Moreover, online dating awareness is highest among college graduates and the relatively affluent, an attractive demographic for advertisers. See a chart from Pew Research Institute below:
Great. We're agreed. Investing in a company levered to the mobile advertising market has a good macro. Targeting Millennials is even better. How do investors play this theme? Facebook is clearly attractively positioned, but at 19x 2016 EBITDA, it is not exactly cheap. MEET's Mobile advertising business is expected to grow revenues 20% year-over-year, and MEET is only trading for 6.2x 2016 EV/EBITDA and has a 12.5% FCF yield. Moreover, a peer of similar scale, PlentyOfFish, was recently acquired by Match Group for 12-13x forward EBITDA.
The MeetMe Mobile App
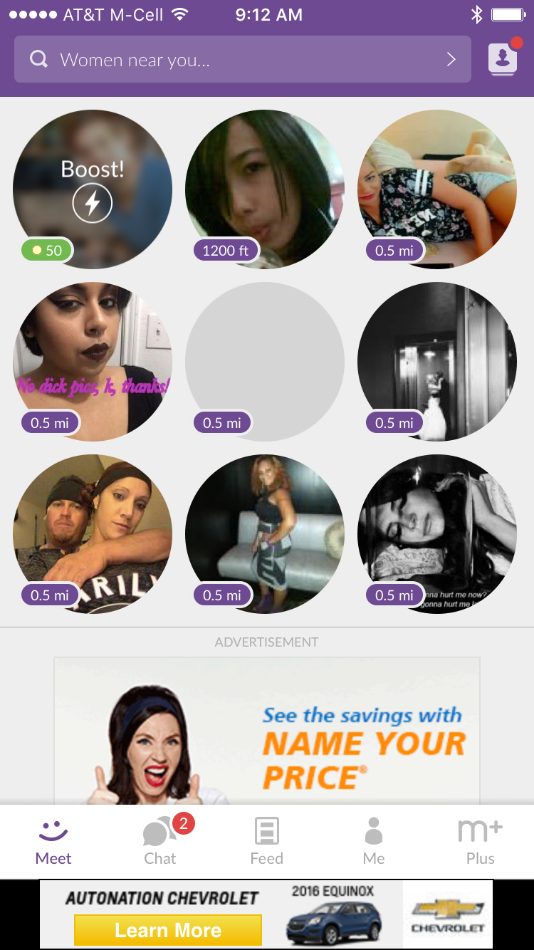
MeetMe is a location-based mobile chat app that serves more than 1.1 million daily active users ("DAU") and 4.0 million monthly active users ("MAU"). People use MeetMe with the hope of meeting a new friend or potential love interest. 54% of MeetMe users have met someone in person that they met through the app. MeetMe generates Mobile revenue from selling advertising, virtual currency, and subscription upgrades. Advertising, virtual currency, and subscription upgrades were 92%, 6%, and 2% of 3Q'15 Mobile revenue.
CEO Cook has made several improvements to the MeetMe app that improved the quality of the user experience resulting in 50% DAU growth and 70% MAU growth from Q1'13 to the end of 2015. But, the most important changes that Cook made over the last 3 years revolve around the mobile advertising strategy. Cook made 2 changes in 2015 that dramatically changed MEET's ability to generate higher mobile advertising revenue: 1) Reducing ad requests by 30%, and 2) taking mobile ad inventory management in-house.
Reducing ad requests by 30%
An ad request occurs any time that MeetMe requests an ad to fill an ad slot in its inventory. For example, the Chevrolet banner ad above filled one ad request and the Progressive native ad above also filled one ad request. When MeetMe requests a new ad to replace either of those ads, that is also an ad request. In April/May 2015, MeetMe made a basic change to its banner and native ads to increase ad duration, which improved click-through rates and dramatically improved advertising rates per ad.
Prior to April/May 2015, MeetMe ads refreshed as users navigated from "Meet" (a tab that suggests people in your area) to "Chat" (a tab that shows your friends that you can chat with) to "Feed" (a tab that shows recent posts from people in your area). Often, users were navigating between these tabs very quickly, and ads may not have had time to load. Ads may not have loaded in an astounding 30% of all ad impressions. This means that users may not have had a chance to determine if they wanted to click the banner or native ad because users never even saw the ad. As a result, these 30% of ad requests saw a 0.0% click-through rate ("CTR").
Very simplistically, higher CTRs result in higher advertising rates per ad (aka Cost-per-thousand impressions or "CPM"), and achieving CTRs above 0.4% results in significantly more competition for inventory. In other words, achieving CTRs greater than 0.4% means that more advertisers want to advertise in your app, which drives more competition for your ad inventory and higher CPMs.
In April/May 2015, MeetMe changed ad request protocol. Ads no longer refreshed every time a user moved between the "Meet", "Chat" and "Feed" tabs. Instead, ads started refreshing after about 10 seconds. Overnight, the 30% of ads delivering 0.0% CTRs were no longer a significant drag on total MeetMe CTRs because every ad loaded and users had the opportunity to view and click on all ads. MeetMe concurrently reduced the number of ad impressions by 30% and CTR increased 62% in July 2015 versus April 2015. I believe MeetMe increased its CTR above 0.4%, which led to higher quality advertisements from companies like Progressive, Chevrolet, Pepsi, Uber, Wal-Mart, Whole Foods, Google and others.
Taking Mobile Ad Inventory Management In-house
From October 31, 2013 to June 2, 2015, MeetMe outsourced its mobile ad management to a third party. Pinsight, a division of Sprint, managed MeetMe's mobile ad inventory from October 31, 2013 to February 28, 2015. Sprint's management change in January 2014 led to a winding down of Pinsight, and MeetMe was forced to change its mobile ad management platform. At the time, BeanStock already managed MeetMe's web ad inventory and assumed MeetMe's mobile ad inventory on March 1, 2015. BeanStock offers publishers (like MeetMe) a one stop shop to avoid the cost of building an internal mobile ad management team and earn more consistent advertising rates (aka Cost-per-thousand impressions or "CPM"). Mobile ad management platforms like BeanStock are able to perform important functions like running real-time auctions to fill ad inventory with the highest paying ad. In exchange, MeetMe agreed to receive a fixed price per ad from Beanstock. Therefore, BeanStock could make a lot of money if MeetMe's ad inventory was generating significantly greater CPMs than the fixed price BeanStock had to pay MeetMe.
On June 3, 2015, MeetMe fired BeanStock and brought mobile ad inventory management in-house in order to capture economics that it was giving to BeanStock. MeetMe saw an opportunity to optimize its advertising management strategy and made changes to its Ad Logic to serve more targeted ads. Targeted ads often have higher CTRs which result in higher CPMs and higher revenues. MeetMe has significant user data including: gender, age, relationship status, sexuality, interests, religion, ethnicity, and education. Just a guess, serving for-profit college education ads to college graduates probably wouldn't see high CTRs. MeetMe is early in the process of tailoring ads to match user interests.
The mobile ad management industry has evolved since the last time MeetMe managed its ad inventory in-house (October 30, 2013), and publishers can more easily manage their ad inventory today. Integrating with companies like Millennial Media and MoPub is drastically simpler and more effective than in 2013, and MeetMe is well equipped to manage its ad inventory with CRO Bill Alena's expertise and experience.
MeetMe's changes to its Ad Logic are already driving meaningful mobile advertising revenue growth. In 3Q'15, mobile CPMs, mobile ARPU and mobile ARPDAU year-over-year growth was 88%, 32% and 44%, respectively.
Please see a table of historical DAU, MAU, Mobile ARPU (Average Revenue per User) and Mobile ARPDAU (Average Revenue per Daily Active User) below.
(click to enlarge)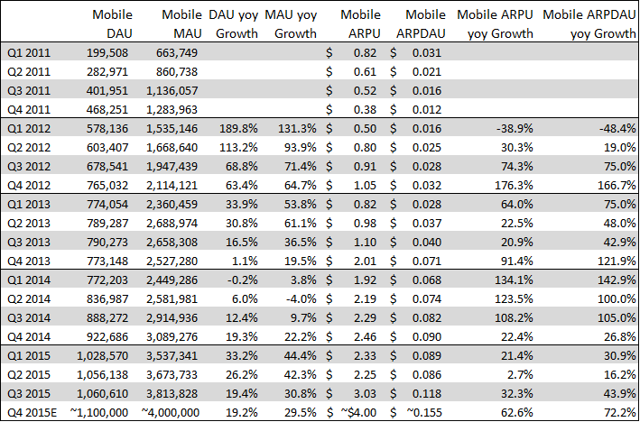
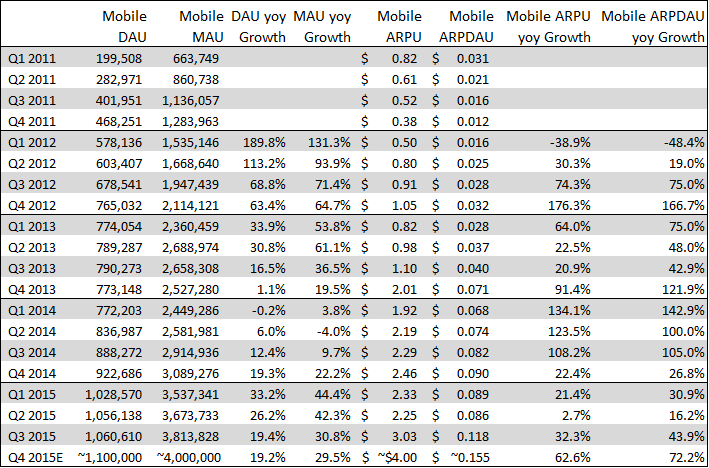
On January 6, 2016, management preannounced Q4'15 results that exceeded guidance. Press releases in 2015 announced that Mobile DAU exceeded 1.2 million for the first time on December 7, 2015, and Mobile MAU exceeded 4.0m in November 2015. These releases give us enough information to estimate that ARPU was ~$4.00 in Q4'15 and ARPDAU was ~$0.15, both of which are records for the company.
Mobile Opportunity Conclusion
MEET is attractively positioned to benefit from the large macro trend that mobile advertising spend is likely going to increase over the coming years. Furthermore, MEET has detailed information on its Millennial-centric user base that allows advertisers to target Millennials, who spend more time on their mobile phone than any prior generation. MEET's fundamental and sustainable changes to its Ad Logic over the last year are going to drive drastic increases in MeetMe CPMs and better monetization of its mobile user base.
Web Opportunity - (~10% 2015E Revs, ~5% 2016E Revs)
MeetMe's Web business is similar to its Mobile business. MeetMe.com allows users to perform most of the same functions as the mobile app. Millennials are accessing MeetMe from their desktop PC less often, thus leading management to spend less time and money developing the Web business. MeetMe's Web interface serves about 1.1 million MAU and 100,000 DAU.
I view the Web business is a business in secular decline that management will likely continue to run as a complement to the mobile app.
Social Theater Opportunity - (~11% 2015E Revs, ~10% 2016E Revs)
Social Theater is a different business model than the Mobile or Web businesses. Social Theater enables publishers to incentivize their users to take certain actions in exchange for the hosting platform's virtual currency. Social Theater advertising runs not only on MeetMe, but on other apps as well. For example, a freemium game that I downloaded on my iPhone may offer credits that allow me to upgrade gameplay. I can either buy these credits outright, or I could be offered a deal to watch a 30-second interstitial (full screen) video advertisement. In exchange for watching that ad, I could earn credits that I could use in the game. Social Theater receives ad revenue for placing an ad and has to buy the host platform's credits to issue credits to the user.
I view Social Theater as a flattish growth business with margins significantly less than corporate average. This business is still profitable and generates free cash, but Social Theater should not be core to an investor's investment thesis as it will continue to shrink as a percentage of total revenue.
Management
MeetMe's management team is strong for a $150 million market cap company. MeetMe's management team has a track record of success and is well equipped to successfully monetize its users.
Geoff Cook (Chief Executive Officer)
Cook has a history of successfully launching, growing and selling companies. Cook founded EssayEdge and ResumeEdge while a student at Harvard University in 1997 and sold both companies (organized under CyberEdit) to The Thomson Corporation (TORONTO: TRI) in 2002. Cook co-founded myYearbook in 2005 and grew it to $30 million in revenues before agreeing to be acquired by the Latino social networking site Quepasa (formerly NASDAQ: QPSA) in July 2011. Cook took on the Chief Operating Officer role at Quepasa in November 2011 at the time of the acquisition. On June 1, 2012, Quepasa Corporation changed its name to MeetMe, Inc., and MeetMe discontinued substantially all legacy Quepasa operations. Cook has been CEO of MEET since March 11, 2013.
David Clark (Chief Financial Officer)
Clark has experience as a Chief Financial Officer at several companies, most recently at Nutrisystem (NASDAQ: NTRI) from November 2007 through April 1, 2013. Prior to Nutrisystem, Clark was the CFO of Claymont Steel from November 2006 to November 2007. Clark also co-founded and served as the CFO of SunCom Wireless from February 1997 to February 2006. SunCom went public in 1999 and was later sold to T-Mobile in 2008. Clark has served as CFO of MEET since April 2, 2013.
Bill Alena (Chief Revenue Officer)
Bill served as Chief Revenue Officer of myYearbook from April 2007 until the myYearbook merger with Quepasa. Prior to working at myYearbook, Alena served as the Director of Internet Advertising at Scholastic Inc., a global children's publishing, education, and media company. Alena was also an early employee of DoubleClick. Alena has served as MEET's CRO since November 10, 2011.
Competition
MeetMe operates in a very competitive market and faces competition from websites and mobile applications whose primary focus is to help users meet new people in their geographical area like Tagged, Badoo, Skout, Twoo, and Meetup. MeetMe also competes against social networking peers that focus on dating like Zoosk, Match, PlentyOfFish, Okcupid, and Tinder.
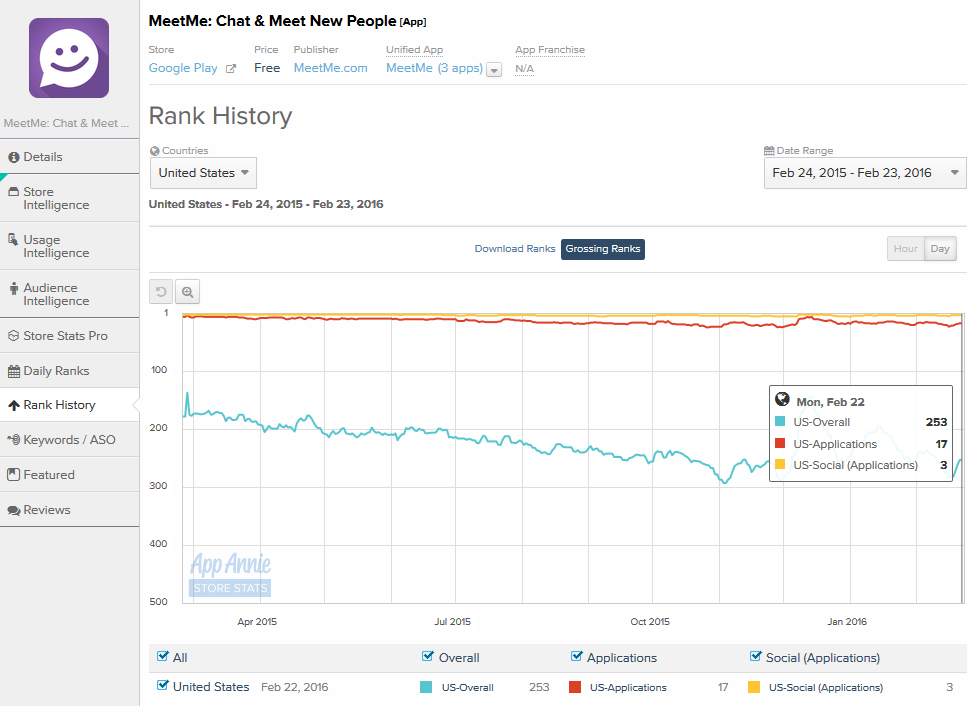
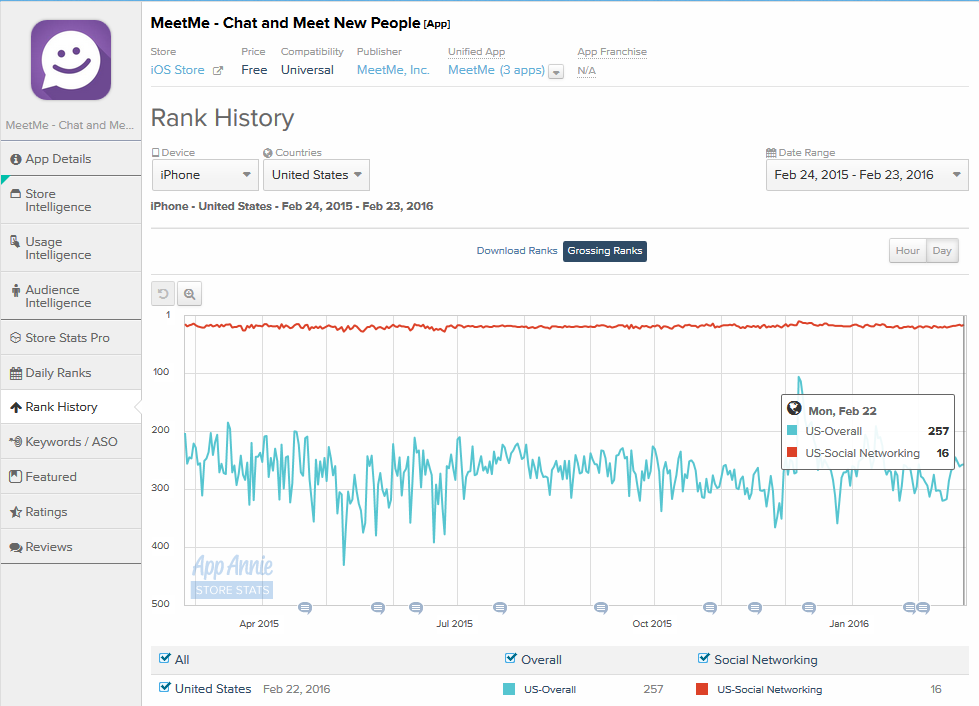
Like many of these competitive apps, MeetMe offers a good user experience, in my opinion. For the most part, these peers rank relatively well in the Google Play and iOS Store grossing ranks. MeetMe is outperforming some of these peers according to App Annie's Grossing Ranks. On February 22, 2016, MeetMe ranked #3 and #16 in US Social Application Grossing Ranks on Google Play and iOS Store, respectively.
MeetMe Google Play Grossing Ranks (Last 365 Days)
(click to enlarge)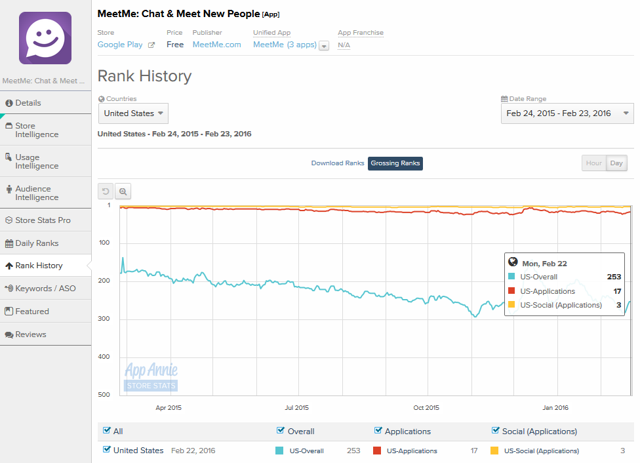 (Source: App Annie)
 (Source: App Annie)
MeetMe iOS Store Grossing Ranks (Last 365 Days)
(click to enlarge) (Source: App Annie)
 (Source: App Annie)
Investment Risks
Mobile CPMs are seasonal with the first quarter being the weakest. MeetMe outsourced its mobile inventory management from October 31, 2013 to June 2, 2015. Investors may not understand that mobile industry CPMs may decrease ~30-40% sequentially from Q4 to Q1. Even if mobile CPMs decrease 35% sequentially in Q1'16, I believe CPMs will increase ~55% year-over-year in Q1'16.
Mobile ad impressions/user/visit will likely be down year-over-year in 1H'16 because management changed ad request protocol and reduced the number of ad requests but increased the duration of ad impressions. I believe a decrease in ad impressions/user will be offset by CPM year-over-year. Analysts may not appropriately model a decrease in ad impressions per user in 1H'16.
MeetMe operates in a very competitive space, and MeetMe's users could decrease if management fails to continue to develop new features that enhance and improve the user experience.
The mobile advertising market is nascent and has not gone through a major recession. The effect an economic recession would have on mobile CPMs is uncertain; however, during the Great Recession internet advertising rates fared better than all other media platforms. I believe the mobile advertising space today is similar to the internet advertising market in 2008. Internet advertising spend outperformed all other media platforms in the Great Recession.
MeetMe is growing its subscription offering, and CEO Geoff Cook would "like to see revenue from subscription at least double in 2016" from approximately $1 million in 2015. Match Group (NASDAQ: MTCH) reported disappointing subscriber growth in the Q4'15 quarter on February 3, 2016. Importantly, MEET's subscription revenue is only 2% of mobile revenue.
Facebook recently added ads to Instagram, and Match Group plans to monetize Tinder through ads. Mobile CPMs could decrease if many publishers all turn on mobile ads before demand has sufficiently developed.
Operating Leverage
MEET has attractive income statement leverage. After covering fixed costs, each Mobile advertising dollar has very little associated variable cost. Marketing cost is the major variable cost in the model. I assume each additional dollar of Mobile revenue contributes ~$0.70 to EBITDA, and 80% of EBITDA converts to free cash flow. Therefore, 55% of each incremental Mobile revenue dollar should convert to FCF.
CAPEX was initially guided to be $3 million in 2015, and later revised on the 3Q'15 call to be closer to $2 million for 2015. I expect that 2016 CAPEX needs will be roughly in-line with 2015, which is congruent with management commentary on the 3Q'15 earnings call.
Management paid down approximately $1.6 million in debt in the 9 months ended September 2015 to reduce total debt to $1.3 million. I expect management to continue to use FCF to pay down debt, and MEET could have ended 2015 with no debt outstanding.
MEET had $72m in net operating loss carryforwards at the end of 3Q'15 that will shield the company from cash taxes for the foreseeable future. I expect 2016 CAPEX, taxes and interest expense to be ~$3 million.
Analysts are currently expecting MEET to generate $64.5 million in 2016 revenue and $23 million in 2016 EBITDA. Therefore, I expect MEET to generate $20 million in FCF on $23 million in EBITDA.
What do you do with all that cash? Management announced a $3 million share repurchase program to be completed between September 30, 2015, and March 31, 2016, on the 3Q'15 earnings call. I expect management to continue to buy its stock at current levels with cash from operations.
Valuation - (see comp tables in appendix)
I examined MEET's valuation relative to internet peers based on several criteria:
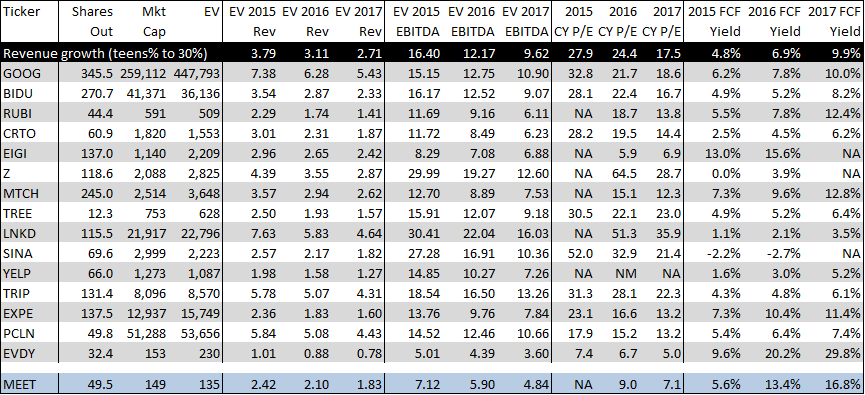
- Internet companies (n=15) with 2016 and 2017 expected revenue growth from 15% to 30%. MEET's revenue growth is expected to be 15% and 14% in 2016 and 2017, respectively.
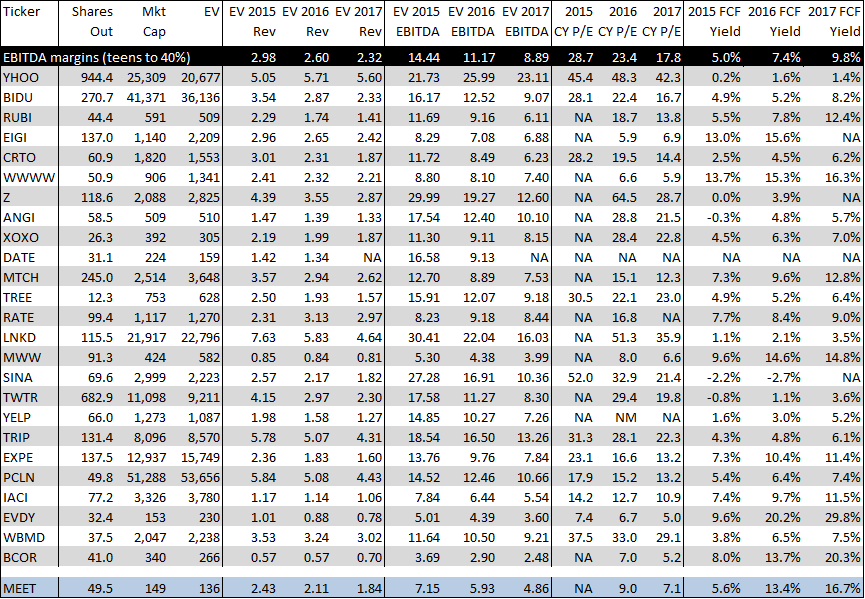
- Internet companies (n=25) with 2016 and 2017 expected EBITDA margins from 10% to 40%. MEET's EBITDA margins are expected to be 36% and 38% in 2016 and 2017, respectively.
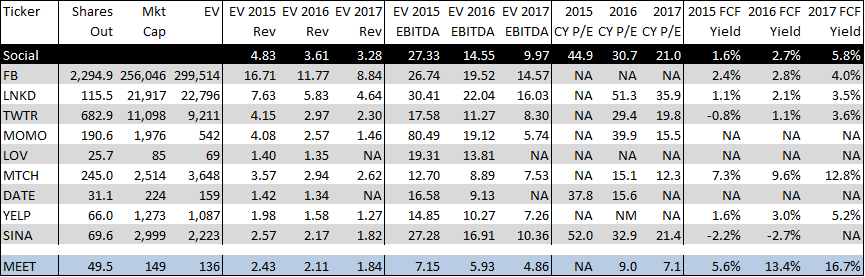
- Social companies/industry comps (n=9).
Internet comps (see comps in appendix) trade for 11-12x EV/2016 EBITDA, 23-24x 2016 EPS, and have a 7% FCF yield as of February 3, 2016. MEET trades at 6.2x EV/2016 EBITDA, 11.8x 2016 EPS, and has a 12.5% FCF yield. MEET is trading at a ~50% discount to internet comps basically across the board. MEET may get a discount to this comp group because it's a small cap stock. However, unlike many small caps, MEET has a superior EBITDA margin profile (high 30s%) and trades relatively well with average volume exceeding $5 million/day over the last 30 days.
Arguing for a 10x EV/2016 EBITDA multiple (a 15% discount to peers) yields a $5.40 stock price when giving MEET credit for $20 million in 2016 FCF. A 20x 2016 EPS multiple (a 15% discount to peers) yields a $6.60 stock price. And finally, an 8% FCF yield (a 15% discount to peers) on 2016 FCF of $20 million yields a $5.05 stock price. I average these three valuation criteria to get a $5.70 one-year target price, ~80% higher than current levels.
We've established that I think MEET is cheap based on consensus estimates; however, I think that MeetMe could beat consensus estimates in 2016. Mobile ARPU growth benefitting from easy year-over-year compares in 1H'16 and potentially increased marketing spend driving DAU and MAU growth could drive upside to consensus. Owning growth companies with potential for significant multiple expansion along with upward estimate revisions has proven to be a successful strategy for me.
Technical Analysis
The last piece of the puzzle. My most successful ideas have historically had the following characteristics:
- A valuation discount to peers,
- Conservative analyst estimates, and
- Positive technicals
The 6-month and 2-year charts show a textbook climax-top running into historical resistance at $4.40.
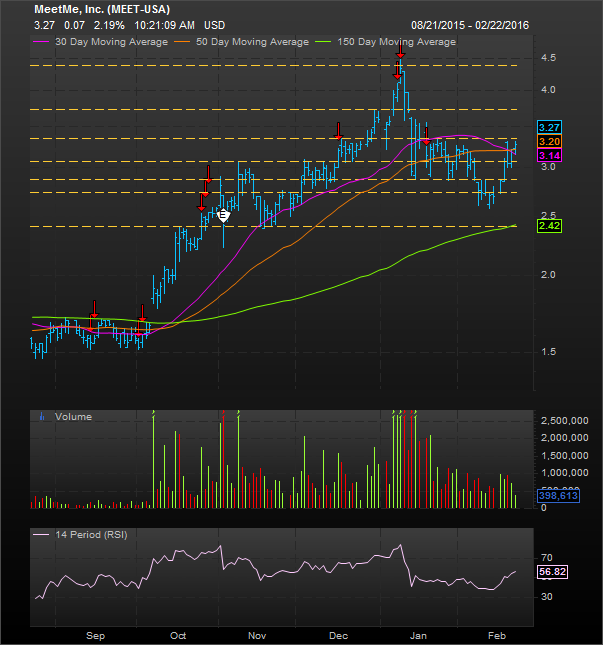 (Source: Factset)
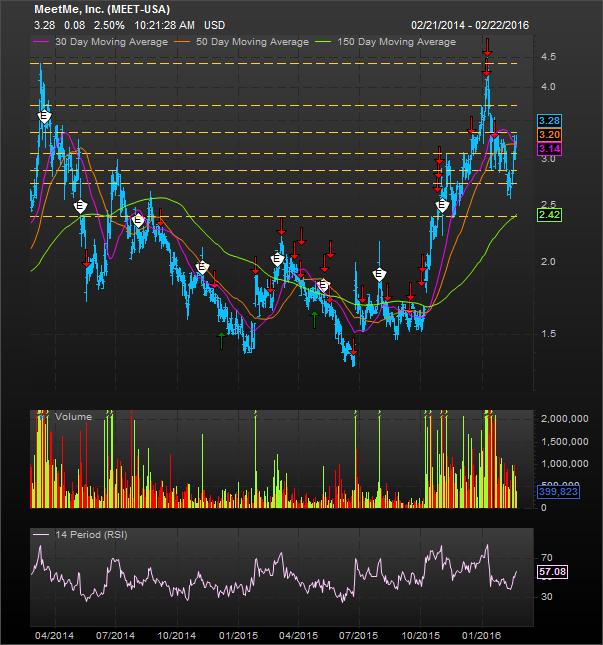 (Source: Factset)
I would say that I definitely have identified a valuation discount to peers and potentially conservative analyst estimates. The technical picture looks mixed right now. The technical picture was very positive when the stock ran from a low of $3.20 on January 4, 2016 to $4.50 on January 8, 2016.
After the climax-top on 1/8/16, the chart tried to hold historically significant support at $3.07 but failed. MEET violated another important support level at $2.73, and I expected MEET to retest very strong support at $2.40. Instead, MEET found support ~$2.60. If MEET retests $2.40 or breaks through $3.34, I will change my technical assessment to positive.
Short-term investors may choose to wait until MEET retests $2.40 or breaks through $3.34 to initiate long positions. Investors with a longer investment horizon should buy MEET today because 1) the change in MEET's mobile advertising model is still not yet fully understood by the market, 2) upside is still significantly greater than downside, and 3) fundamentals will be the main driver of stock performance over multiple years.
If MEET retests $2.40 or breaks through $3.34, I will have the three traits that have marked my best investment ideas, and I will be excited to own MEET over the short, intermediate and long term.
Appendix
Internet Comps with Revenue Growth between 15% and 30%
(click to enlarge)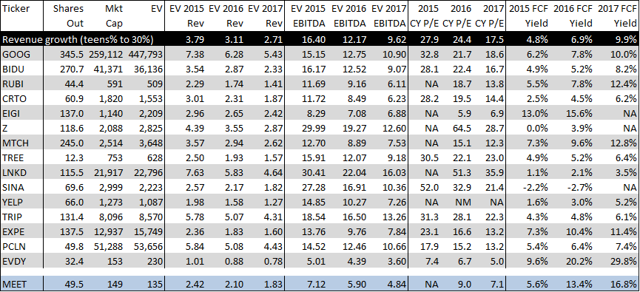
Internet Comps with EBITDA margins between 10% and 40%
(click to enlarge)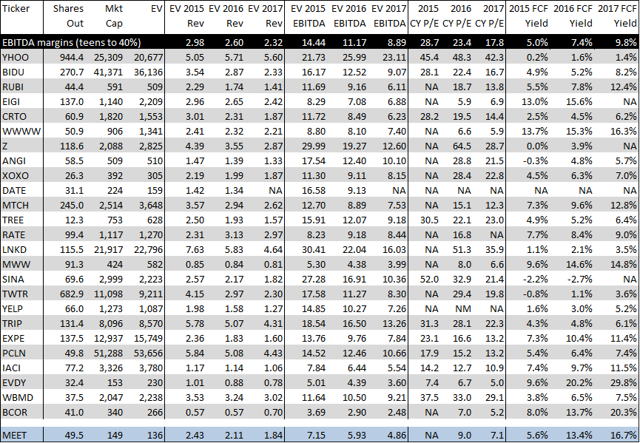
Social Comps
(click to enlarge)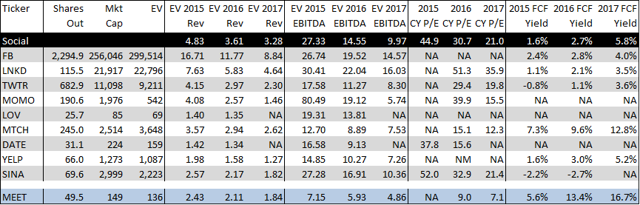
Disclosure
The author of this posting and related persons or entities ("Author") currently holds a long position in this security which can currently be considered a long-term holding. Author may buy additional shares, or sell some or all of Author's shares, at any time. Author has no obligation to inform anyone of any changes to Author's view of MEET. Please consult your financial, legal, and/or tax advisors before making any investment decisions. While Author has tried to present facts it believes are accurate, Author makes no representation as to the accuracy or completeness of any information contained in this note. The reader agrees not to invest based on this note, and to perform his or her own due diligence and research before taking a position in MEET. READER AGREES TO HOLD HARMLESS AND HEREBY WAIVES ANY CAUSES OF ACTION AGAINST AUTHOR RELATED TO THE NOTE ABOVE. As with all investments, caveat emptor.


 TWITTER USER GROWTH. IMAGE SOURCE: TWITTER.
 DATA FOR CHART RETRIEVED FROM COMPANY SEC FILINGS FOR QUARTERS SHOWN. CHART SOURCE: AUTHOR.

 have been lost. Investors who use strategies other than DGI have been crushed by declining share prices, too. (And do I even need to mention that neither APC nor RIO are exactly classic DGI portfolio holdings?)